Event Tracking and Management
For motorsports, offshore powerboats, yachts, etc. Displays stage times, seedings, prizes, etc in live time. Smartphone integrated, can be personalised, great for spectators.
User-friendly, Real Time, Customisable
Works the way organisers & competitors actually want it
Features:
- Sensor monitoring (eg: temp, pressure)
- Rules & alerts e.g. geo-fences
- Filter and compare data
- Track history
- Automatic email or SMS notifications
- Smart phone integrated
- Speed vs Time Graph
Benefits:
- Easy visual real-time professional quality data
- Ensure compliance to safety rules
- Less staff required to run events
- Instant notification if something goes wrong
How it Works
Through the TrackIt Dashboard you can view all KPI data for drivers including speed, location and driving time. The Dashboard has been specifically designed to give you as much information as possible on one screen so that you can macro manage your fleet and not spend ages drilling through screens to find what you want to see.
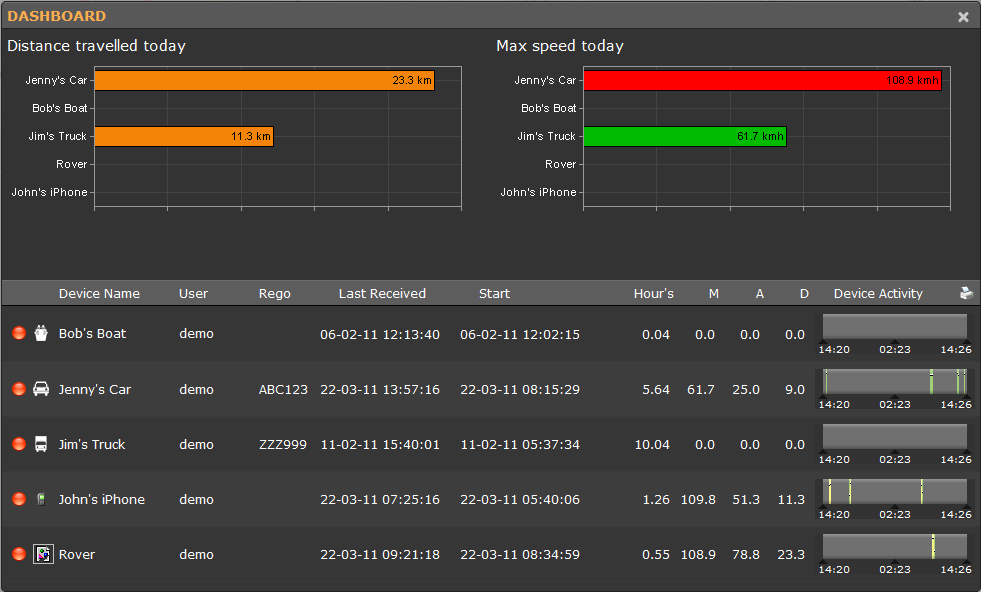
Dashboard
Through the TrackIt Dashboard you can view the current status for all devices within an account and monitor all KPI data for driver behaviour including speed, idle time and driving time.
The Dashboard has been specifically designed to give you as much information as possible on one screen so that you can macro manage your fleet and not spend hours drilling through reports to find good or bad behaviour.
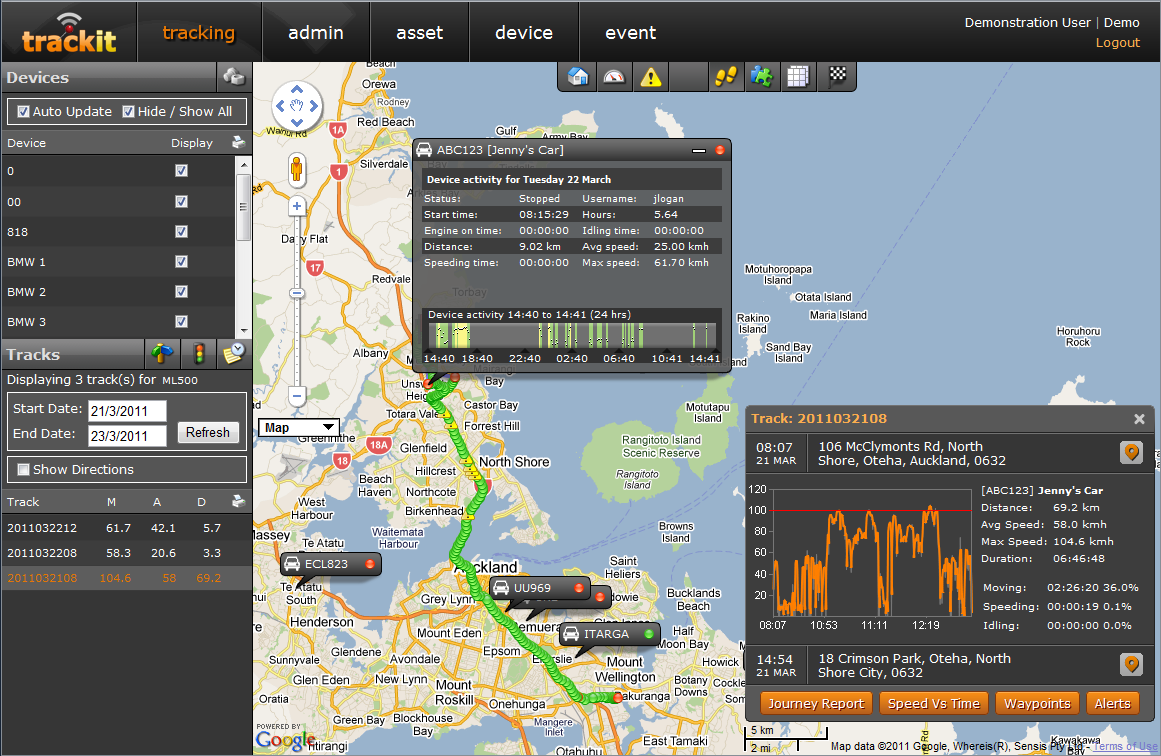
Real-time Tracking Screen
Displays the current location for all known devices and indicates their current speed and status.
Through the tracking screen you can quickly locate devices, display their current statistics and view their tracks.
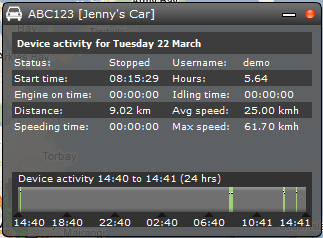
Device Information Window
When a Device is selected the Information Window is displayed which contains all of the key performance indicators (KPIs) for any given device and provides a complete overview of recent behaviour.
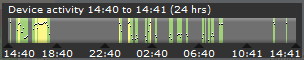
TrackBar™
The TrackIt TrackBar™ displays information for the past 24 hours and uses different colors to represent device status for each 10 second slice.
Moving, speeding, working and idling are all represented using different colors and the TrackBar™ provides a clear picture of driver behaviour over the past 24 hours.
By clicking on the TrackBar you can also zoom in and view detail for any given 3 hour timeframe.
Moving your mouse over the TrackBar™ will give you further detail on KPIs.
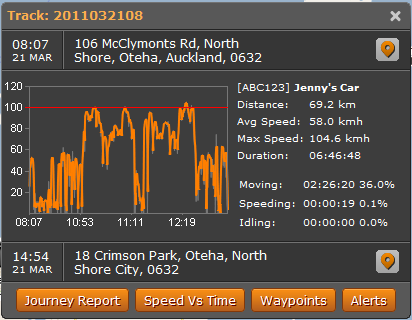
Track Information
Device waypoints are automatically grouped into Tracks based on a number of account and device parameters.
For example; if a sales vehicle is stationary for more than 2 hours then a new track is automatically created.
The track information window displays all key information for a given track such as start address, finish address, time taken, maximum speed, idle time, etc.
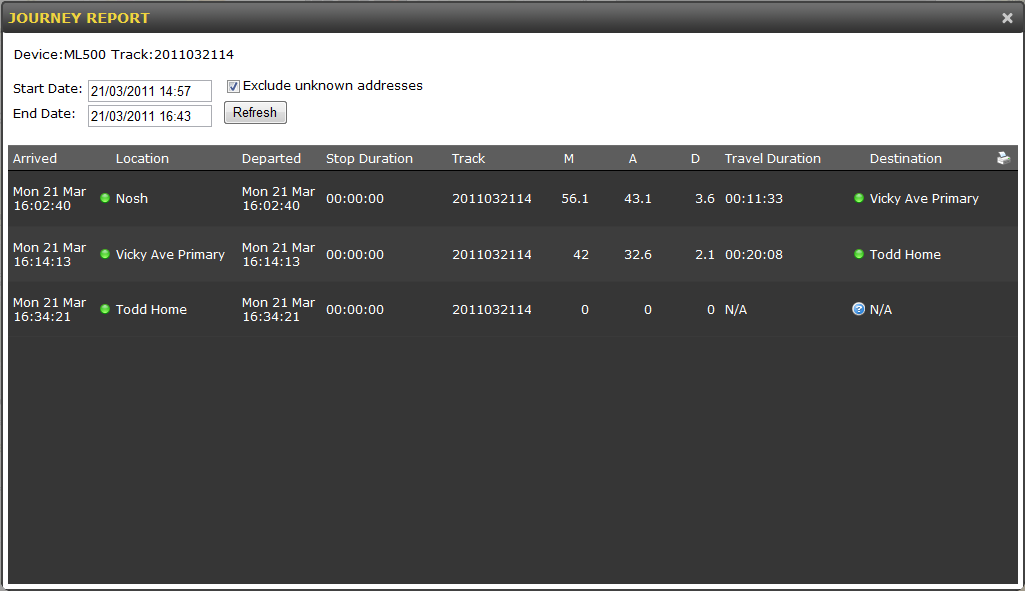
Journey Report
Provides a nice human readable report of any journey using addresses you have loaded or reverse geocoding data.
The Journey Report lets you know where someone has been, how long each leg of the journey took, how fast they were travelling, how long they spent at each stop, etc.
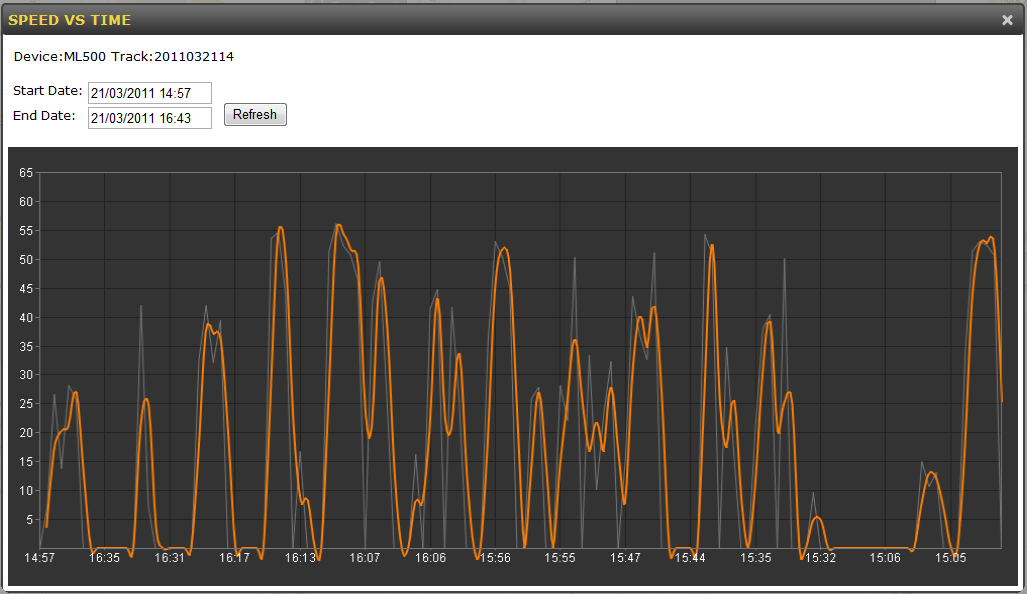
Speed vs Time Graph
One of the most important things to monitor is speed.
Through the Speed vs Time graph you can quickly identify how fast a device was going and where on the track they exceeded any speed limits.
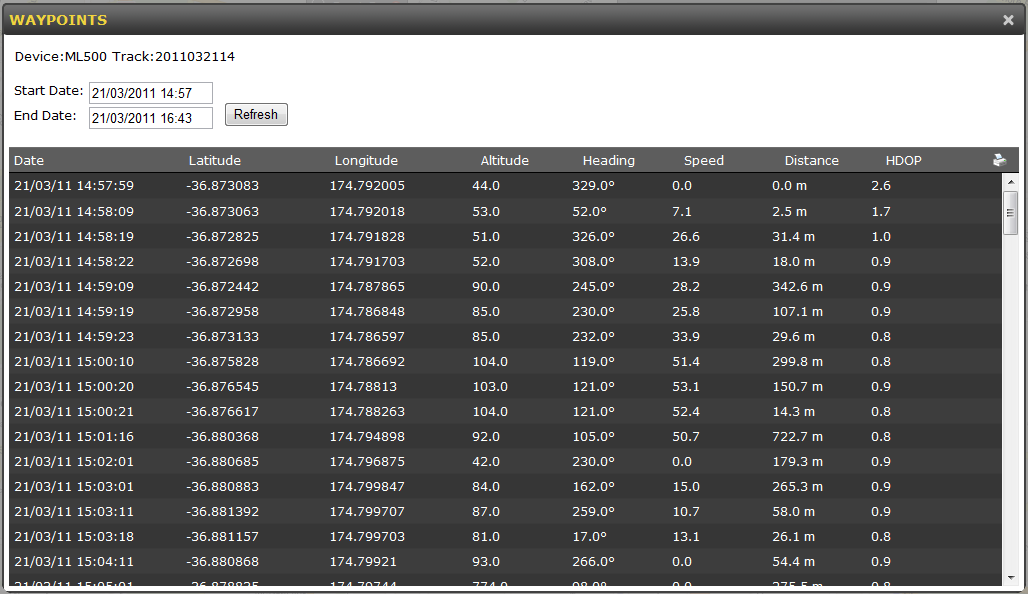
Waypoints Report
Just in case you need to access the detailed waypoint data for any track we also provide a report and the facility to export the detailed waypoint data.
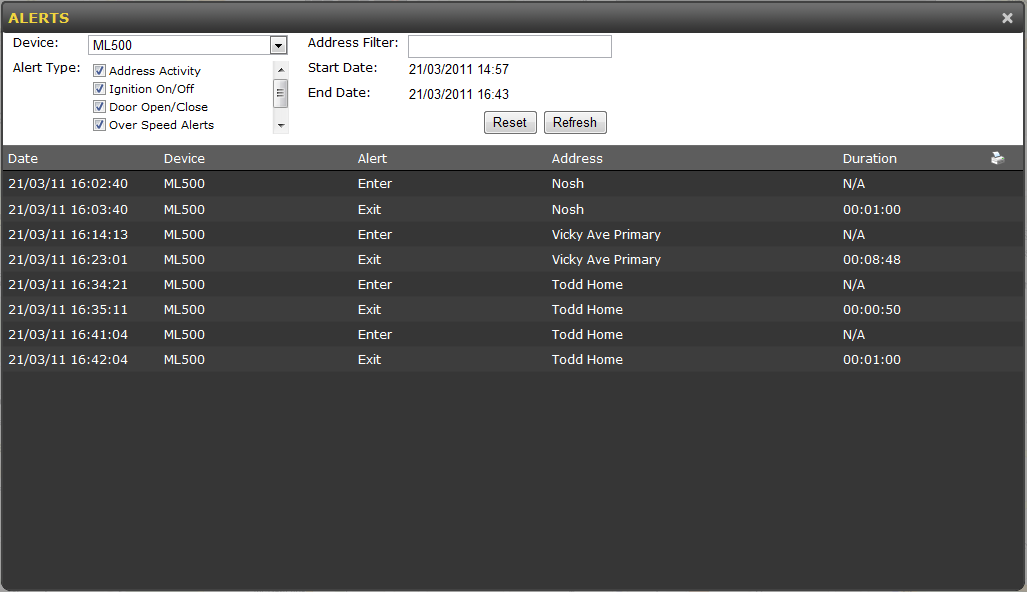
Alerts
Alerts are generated automatically whenever a speed limit is exceeded, geo-fence is entered/exited, maximum idle time is reached, etc.
You can also define your own custom alerts based on time, location, and KPI data so that any behaviour can produce an email or SMS notification.